|
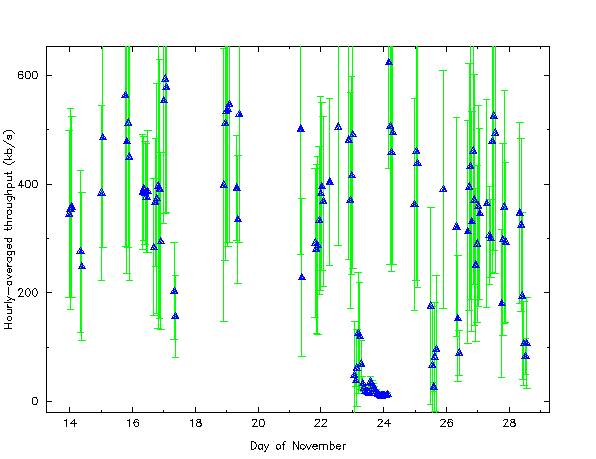
| Fig. 1. Archive transfer rates averaged over one hour periods (blue triangles). The green error bars represent the R.M.S. fluctuation above and below the average. See Appendix C for a display of this data split between two graphs. |
December 2, 1996
(updated August 7, 1997)
The increasing data rate presents a number of technical challenges including the problem of data archiving. Simply put, the data must be archived faster than it is produced; otherwise, short-term disk storage will eventually fill up and bring the flow of data to a halt. The maximum sustainable rate that data can be archived places a constraint on the science that can be done with the telescope. This study attempts to address the question of how high a rate can the archiving system support.
During normal telescope operation, data is collected at a rate well below the limit of the real-time archiving system, so the data flows reasonably well from the telescope at Hat Creek to the archive and NCSA (University of Illinois) to observer at other institutions. Occasionally, archiving can become stalled for a period of time, but because of the low data production rates, the system can quickly catch up once the problem is resolved. However, operation during A-array, when sampling time is small and the data production rate is high, has in the past been problematic. If the network goes out, the effects are more noticeable if the archiving system spends a significant amount of time catching up. Thus, regularly occurring problems such as network outages and software failures place more stringent limits on the archiving rate beyond the raw bandwidth of the network carrying the data.
In this study, three factors that can limit the data archiving rate is considered:
A recent NCSA study of Internet performance (Welch and Catlett, 1996) provides some important data for isolating the effects of the Internet on the archiving rate. This study measured network performance between NCSA and a number of sites around the country. Hat Creek was included as one of these sites, and data was taken over three months (March to May 1996). The major results for the Hat Creek tests included:
There are several reasons why this data is not sufficient for answering the archiving rate question.
bima.berkeley.edu, the
data-collecting machine at that time; the May tests were
conducted between NCSA and bima2.berkeley.edu,
relatively unloaded machine meant for interactive users.
HCarchXd) running on hat.berkeley.edu that sends
data and another (UIarchXd) on the archive server to receive it.
HCarchXd continuously loops, in each cycle sending as much data as
possible and then sleeping for 30 seconds. During the non-sleeping
portion of the loop, the daemon checks over the collection of data it
is currently monitoring to see what has been updated since the last
successful send. Via communications with UIarchXd, it
compares the current size of the updated files with that of the copies
at NCSA. The new data is then sent to UIarchXd which
appends it to appropriate files at NCSA.
With each file being updated, HCarchXd sends the new data
to UIarchXd in 65 kilobyte (kB) chunks. This chunk size
corresponds to the maximum data window size currently supported by
hat's operating system (OS) for the T1 line from Hat
Creek to Berkeley. This choice of chunk size has the effect of
allowing the HCarchXd process to obtain as much of T1
bandwidth as the operating system will allow it. If no other
processes wish to use the network, then the window will be completely
filled with new telescope data.
The throughput of the archiving system was measured by timing how long it takes to send the individual chunks of data. This was done by recording a time-stamp just before and after the write statement that fills the window. The difference, however, is not necessarily the desired time; this is because the write statement writes to an internal buffer for the OS to process, and thus can return very quickly. However, the next attempt to write may find the buffer still full as the OS is still sending the chunk of data; this condition causes the write statement to block, or wait, until the previous chunk has been successfully sent. Thus, a measure of the transfer time is gotten by computing the difference between an after-write time-stamp for a data chunk and the before-write time-stamp of the previous chunk.
The transfer time computed in this way includes both overhead in the software (time within the write loop when not actually writing) and time lost through the competition for system resources. For example, if the archiver must share a network data window with other processes, more windows will be needed to send the 64 kB window. The transfer time measurements can be combined to compute the time for transferring all the new data for a particular file or for the collection of files during periods between the software's 30-second naps; doing so includes more of the software's overhead.
Timing data was taken during regular A-array observer from Nov. 14 to
Nov. 29, 1996. (A list of projects observed during this time can be
found in Table 1 of Appendix
B.) An archiving throughput rate was computed each time there
were two consecutive writes of full 64 kB (i.e. 65536 bytes) chunks of
data. Certain data files, such as Miriad data items
header and vartable, do not grow very
rapidly (2) and thus tend to be transferred in
chunks smaller than 64 kB. As a result, the throughput measurements
were calculated mainly for the visdata and
flags items. For analysis, throughput measurements were
collapsed into time-averaged values.

|
| Fig. 1. Archive transfer rates averaged over one hour periods (blue triangles). The green error bars represent the R.M.S. fluctuation above and below the average. See Appendix C for a display of this data split between two graphs. |
The throughput for the first week was characterized by fairly normal conditions during which the transfer proceed without much difficulty. The second week, however, was characterized by various problems with the server machine. For instance, a major system problem on the server machine was responsible for the very low transfer rates all day on Nov. 23. Another server system failure, also gave low rates on Nov. 25. The average throughput for the period Nov. 14-20 was 450 kb/s (RMS=240 kb/s).
One should not necessary exclude the results during the problematic periods from the analysis. It is not untypical for the Internet to become equally bogged down or even down completely for a similarly extended period like this; I would estimate that in practice such problems with the network occur on the average of every other week.
The green error bars in Fig. 1 representing the RMS deviation above and below the measured value illustrate large variation in the achieved transfer rates. This variation takes place at the per chunk level where one chunk might get transferred very quickly while the next chunk travels several times slower. The variation appears completely random.
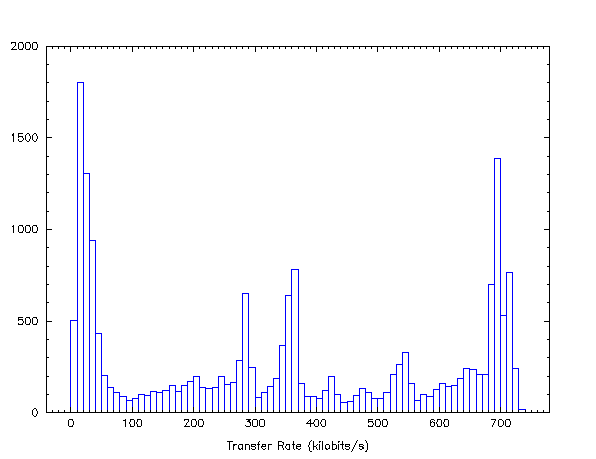
The distribution of measured transfer rates, however, do not appear random, as shown in Fig. 2. The high number rates measure to be less than 60 kb/s is almost entirely due to the periods of server system trouble on Nov. 23 and 25. Excluding this data, one can see that a maximum of about 700 kb/s was often achieved; however, lower rates were more typical. It is interesting to note peaks at 280, 250, and 525 kb/s. It is likely that these rates represent some systematic behavior of the network in how it distributes bandwidth to individual processes.

|
| Fig. 2. Histogram of transfer rates measured during entire testing period. The large number of rates measuring less than 60 kb/s are almost all due to the periods of server system trouble which occurred on Nov. 23 and 25. |
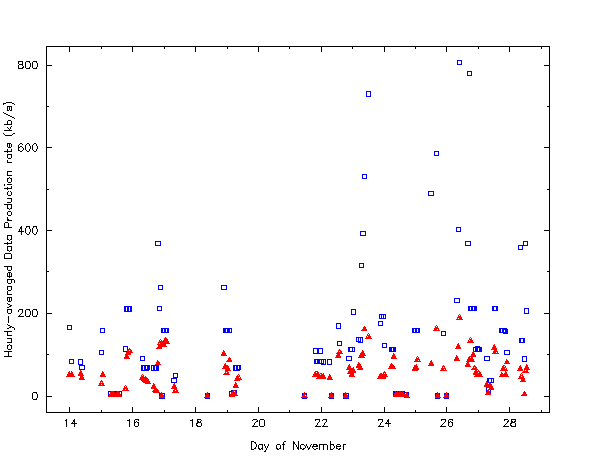
In general, the data production rate was much lower than transfer rate most of the time. As a result, when the system recovered from major problems, it took only a few hours or less to completely catch up on the backlog of un-archived data. Estimates of the data production rate by adding up the new amount of new data transferred within a period between 30-second naps (assuming the system is not trying to "catch up"). Figure 3 shows hourly averages of these estimates (green triangles). Occasionally there were short periods of higher data production rates; to illustrate this, Fig. 3 shows the peak data production rate within 1 hour intervals. Most of the points falling within periods of system trouble were removed as the archiver was trying catch up on the back log of data; however, the high peak data rates remaining in Fig. 3 near those times are also likely to be erroneous.

|
| Fig. 3. Estimates for the data production rate averaged over one hour periods (red diamonds). The peak data production rate within hour intervals appear as blue squares. Note that most of peak values > 250 kb/s are not likely to be good estimates for the peak data rate but rather reflect periods when the archive is "catching up" with the transferring of older data. |
The overall average data production rate was 56 kb/s (RMS = 42 kb/s). The occasional excursions to higher rates data rates larger than 100 kb/s were for the most part lower than typical archiving rate.
Occasionally during the testing period, the hat machine
was monitored for other activity. Although a some interactive
processes were found (user shells with only a few from remote sites),
they were found to be idle most of the time. This suggests that users
are generally following the policy that limits interactive and data
processing on the hat machine.
At various times the receiving of data by UIarchXd was
monitored, though no timing data was recorded. Similar to its partner
daemon, UIarchXd tries to read in data in 64 kB chunks.
When the reading was monitored, it was observed that while the data
was being written "to the network" by HCarchXd in 64 kB
chunks, it was received by UIarchXd typically in 0.5 kB
chunks. Occasionally, the size of the chunk would peak as high as 4
kB. Never was it observed to have been read in full 64 kB amounts.
If we can assume that the archiving system has near-sole use of the T1
line to Berkeley, it is then likely that the data chunks are being
broken up somewhere along the Internet leg between Berkeley and NCSA.
Sometime prior to June 1996, a bug was introduced to the
HCarchXd software that caused virtually all files
transferred in real-time to be retransmitted. This bug was corrected
when this program was updated to collect the timing data. Now in a
typical project, the only few small files (for reasons unknown) are
retransmitted. It is not known if this bug existed during the last
A-array.
Another possible limiting factor is competition with other processes
on Hat Creek machines for bandwidth on the T1 line to Berkeley.
I would expect these other processes to be primarily those of
interactive users (say, using the bima2 machine). If such
processes are to have a significant effect, one should be able to see
it the timing data in the form of reduced throughput over observable
time-scales. For instance, remote copies of large dataset or heavy
use of a remote display of an X-application might reduce the archiving
rate over a period of minutes or hours. Many remote, interactive
users might produce diurnal variations in the archiving rate.
However, no systematic variations in throughput are observed on any
scales. Thus, if there is significant competition for the T1
bandwidth, it would have to be relatively constant day and night.
Given the apparent nature of the Hat Creek system and its users, this
is not likely to be the case.
Finally, there is the question of competition for system resources.
How much this contributes is still unclear. Typical load averages for
the two-processor hat machine is about 2.5 which does not
clearly suggest that a process must spend a lot of time waiting for a
system resource. One might infer the significance of this effect by
testing simple file transfer rates from another machine at Hat Creek
(such as, bima2). The
study by Welch and Catlett measured an average throughput to
bima2 of about 500 kb/s. This study used small data
packets which may give different results than when larger chuncks of
data are used. A few measurements of the transfer rate for simple remote
file copying was done resulting in rates mostly around 400 kb/s. It
would be useful to make regular measurements of this type over a
typical period for a more reliable estimate. If 400 kb/s is a typical
number, then competition for system resources is not likely to be a
significant limiting factor to the archiving rate.
One should note that a significant higher data production rate is likely to make the competition for system resources fiercer.
For example, if the system needs to use part of the 64 kb window for processing overhead, then it may actually require two windows to transfer a single 64 kb chunk of data. In this case, a smaller chunk size might significantly improve the overall transfer rate.
Another factor that should be considered in setting a general limit would be the amount of disk space available for storing new data at Hat Creek. When major problems occur that stall or slow the archiving, it may take one to two days for the human archivist to notice and fix the problem, and for the system to catch up to real-time transfering. (Some problems, like Internet traffic, are not fixable except by waiting.) Thus, I would recommend that the general limit also be less than the amount of disk space divided by two days. Thus, for a rate of 256 kb/s, I would recommend having at least 5.6 GB of disk space available at Hat Creek for new, unarchived data. (Note that this space should exist in a single partition as the software looks under directory for new data.)
The current archiving performance can support higher data rates for limited periods of time, and some projects may have important scientific reasons to have exceed a general limit. It would be useful to have a criterion for setting an absolute maximum that provides good confidence that the archiving system will be able to catch up before the local disk fills up. I would recommend that this maximum rate be set such that archiving system can catch up to real-time status within 24 hours at a rate of 350 kb/s. Thus, if the network is down or traffic is particularly heavy for some large fraction of a day, the system should still be able to catch up within two days. This criterion can be described as:
    t X max-limit  +  (24 - t) X general-limit
   -------------------------------------------- = 24,
                         350
where t is the observing time of the project in hours, and the maximum
and general limits are measured in kilobits per second. Thus, the
maximum limit reduces to:
                 8400 - 24 X general-limit
    max-limit = --------------------------- + general-limit.
                             t
This says that the archiving system should be able to comfortably
support an 8-hour project that generates data at a rate of 538 kb/s,
assuming a general limit of 128 kb/s and sufficient disk space. (This
value, however, is may exceed the limit set above by the amount
available disk space.) The definition for the maximum limit assumes that a project generating this amount of data is scheduled next to projects that produce data at a rate less or equal to the general limit. Thus, some care should be taken in the scheduling of high data rate projects. It is suggested that such projects should note the need for a data rate higher than the general limit under the "Special Requirements" of the project proposal coversheet.
The basic scheme of parallel data transfer is one of breaking up data into chunks, write them to the network in parallel, and then re-assemble them in the proper order at the receiving end. Since the chunks would arrive in random order, there must be some way to identify the chunks. There is a variety of ways this might be accomplished. While it would require a significant effort to implement, it would not require major changes to the overall design of the archiving system.
A good way to introduce parallel transfer into the archiving system may be as a technique that is used when the system has large back-log of completed projects to transmit. The completed files could be broken up into smaller files and remote copied. In such an implemenation filenames would serve as the identifiers for re-assembling the data.

|
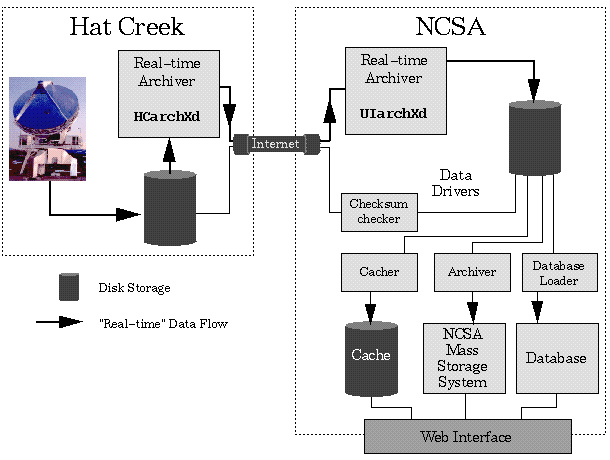
| Fig. A.1. The BIMA real-time archiving system |
The real-time archiver refers to the portion of the archiving
system that transfers data from the Hat Creek Observatory to the NCSA
archive server machine within approximately one minute of its
recording by the telescope operating system (assuming the network is
available and a backlog of data to be transferred does not exist).
This is represented in the above figure by the two daemon processes,
HCarchXd and UIarchXd, which run on the Hat
Creek and NCSA machines, respectively. Post-transfer data drivers
prepare the data for access by users by copying the data to long-term
storage and loading metadata into a searchable database.
The BIMA archive uses the PostgreSQL database management system to store metadata that allow archive users to search for BIMA datasets. Currently, this system is located a separate machine.
The NCSA Mass Storage System (MSS) serves as the long-term storage device. This system is based on a bank of fast IBM Magstar tape drives (loaded by a robotic juke box) and more than 285 Gigabytes of its own disk cache. The drives feature a data rate of 9 Megabytes/second, and they can seek to any position in their 10-Gigabyte tapes in less than 60 seconds. The MSS is connected to the archive server with an FDDI network connection providing 100 Megabits/second transfer rates. Given the performance of the MSS, the bottleneck in a typical session in which a user downloads tens of Megabytes worth of data to a remote workstation is almost always the Internet itself. Of course, loading data onto one of the local NCSA supercomputers (which are also connected to the MSS via FDDI) for processing is not subject to this bottleneck. The MSS uses the UniTree Archival System which provides access to its data by wrapping a UNIX-like filesystem around them. UniTree automatically migrates files between tape and its disk cache as needed. Read-write access to the files is provided via an FTP interface. The archive server also gets read-only access to the files via an NFS mount of the UniTree filesystem. Among the special functions provided by UniTree is the ability to stage files from tape to disk prior to actual access.
See Plante and Crutcher 1997 for a detailed description of the BIMA Archive System architecture and implementation. (Note that this document is also available as a BIMA memo.)
B. Projects Observed During Testing
(In progress.)
| FLUX |
| n102a110.g10 |
| n109a086.w51 |
| n109a109.w51 |
| n112a086.cyga |
| n121a107.w3oh |
| n127a087.g45 |
| n128a110.1623 |
| n128a110.L1448 |
| n128a110.dgtau |
| n128a110.gmaur |
| n128a110.hltau |
| n128a110.i1629 |
| n128a110.rytau |
| n131a110.ttaua |
| n132a086.orims |
| n141a100.sgrb2 |
| n144a115.a220 |
| n146a110.g31 |
| nx24a110.hauto |
| nx31a086.atmos |
| nx32a097.h1413 |
| nx34a086.orims |
| nx35a113.irc |
| date | No. of files | Mbytes |
| 14 | 24 | 730.431 |
| 15 | 9 | 222.937 |
| 16 | 10 | 208.372 |
| 17 | 14 | 232.456 |
| 18 | 17 | 476.103 |
| 19 | 2 | 0.729 |
| 20 | 12 | 224.346 |
| 21 | 15 | 469.156 |
| 22 | 6 | 126.706 |
| 23 | 13 | 419.914 |
| 24 | 17 | 638.771 |
| 25 | 12 | 263.602 |
| 26 | 11 | 210.862 |
| 27 | 17 | 503.546 |
| 28 | 23 | 734.437 |
Plante, R. L and Crutcher, R. M. 1997. The BIMA Data Archive: the Architecture and Implementation of a Real-time Telescope Archiving System, SPIE proceedings, in press. (also available as part of the BIMA Memo Series.)
Roll, J. 1995. Starbase: A User Centered Database for Astronomy, in: Astronomical Data Analysis Software and Systems V, ed. G. H. Jacoby and J. Barnes. PASP Conf Series 101, 536 (1996).
Welch, V. and Catlett, C. 1996. Internet Performance Study,
http://www.ncsa.uiuc.edu/People/vwelch/projects/inetperf.